Attaching package: 'dplyr'The following objects are masked from 'package:stats':
filter, lagThe following objects are masked from 'package:base':
intersect, setdiff, setequal, unionThis first post is to check whether the features I want for this blog work as desired.
These can be summarized in a non-exhaustive list as:
The OLS estimator is given by the equation \(\hat\beta_\text{OLS} = (X^\mathsf{T} X)^{-1} X^\mathsf{T} y\).
On the other hand, the ridge estimator is given by the following formula
\[\hat\beta_\text{ridge} = (X^\mathsf{T} X + \lambda I)^{-1} X^\mathsf{T} y\]
where \(\lambda \in [0, \infty)\) controls the amount of shrinkage applied to the coefficients.
Attaching package: 'dplyr'The following objects are masked from 'package:stats':
filter, lagThe following objects are masked from 'package:base':
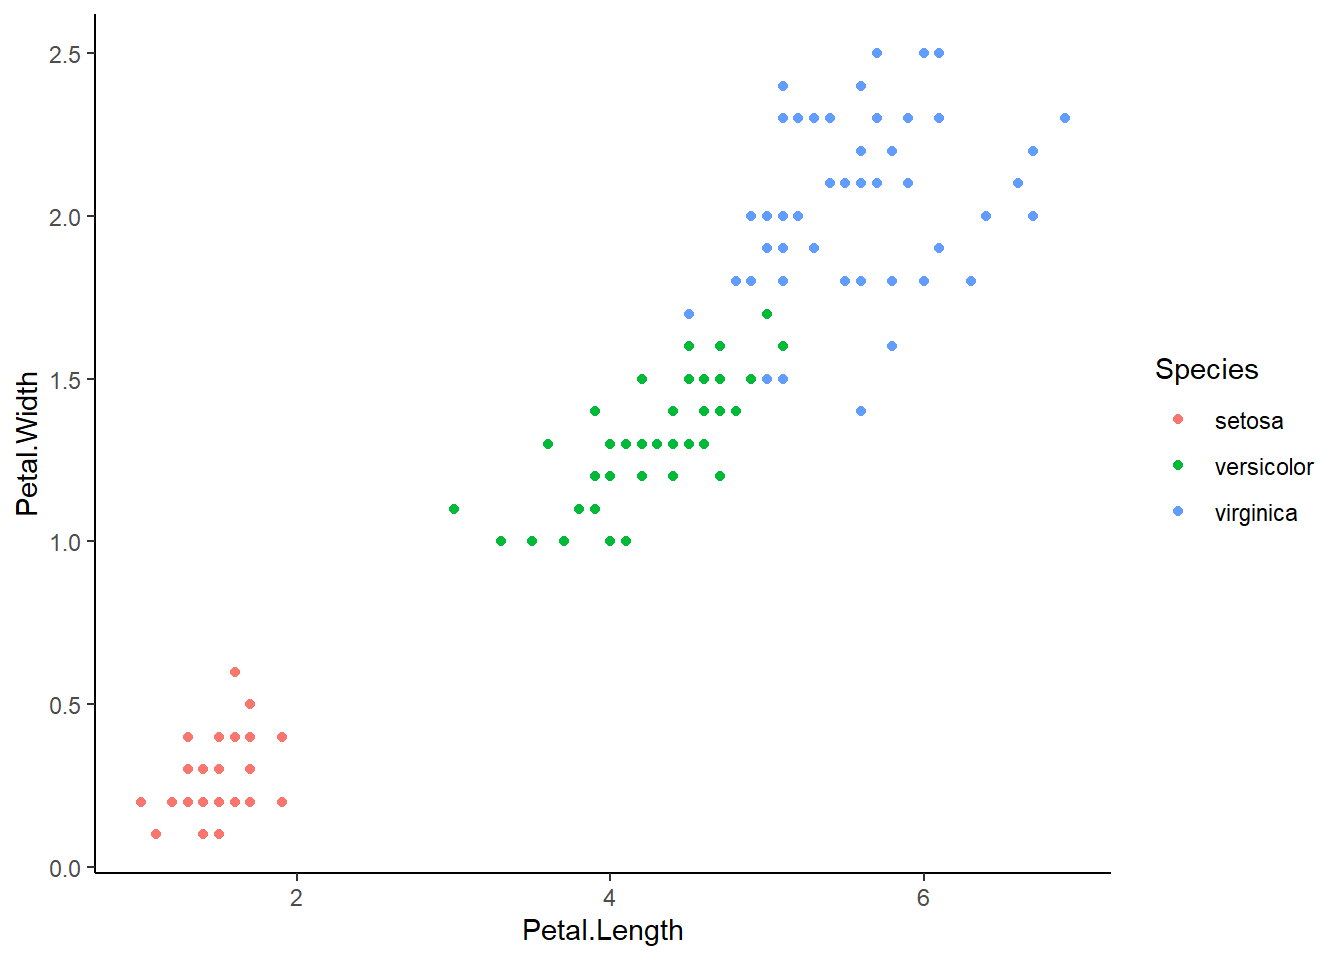
intersect, setdiff, setequal, unionvanilla ggplot
plotly plot